
Weekly Market Commentary July 7th 2022
Correction: An astute subscriber noted that in our last issue of the Weekly Market Commentary, the year-to-date performance number for the S&P/TSX Composite index was erroneously listed as being down 3.4%. The performance numbers were taken mid-day on June 27th. On that day, the S&P/TSX Composite opened down 9.8% year-to-date, and closed the day down 9.4%. We apologize for any confusion that this typo may have caused.
The Markets
The first six months of 2022 have earned a place in history books.
2022 is likely to become part of the lore passed from generation to generation. Stories will be told about this bear market, as well as the remarkable political and social events that have occurred. Here is a brief look back at the last three months.
- Will the real inflation please stand up? Prices continued to rise during the second quarter, although there was a significant difference in inflation readings (We have previously discussed the “problems” with inflation indicators). The [U.S.] Consumer Price Index (CPI) showed inflation was up 8.6 percent in May, year-over-year. The Personal Consumption Expenditures (PCE) Price Index (which excludes food and energy, the categories that have risen the most in price) showed inflation was up “only” 6.3 percent for the same period. North of the border, our CPI reported an increase of 7.7 percent over the same period.
- Central banks attacked inflation. With inflation well above target levels, central banks, such as the U.S. Federal Reserve and the Bank of Canada began to tighten monetary policy. The Fed ended its bond buying program, began to shrink its balance sheet, and both the Fed and the BoC raised rates aggressively (with additional increases likely coming in the second quarter.
- Bond rates rose. Bond rates moved higher during the quarter. Since bond prices move lower when bond rates rise, many investors saw a decline in the value of bond portfolios.
- Stock prices fell. Evie Liu of Barron’s reported, “Energy stocks were the only ones that posted gains in the first half [of the year] on the back of soaring oil prices, but even that sector has lost its momentum…Although energy companies are still pocketing record profits today, traders are quite aware that a recession would drag down demand, curb oil prices, and cut into their earnings.”
- Consumer sentiment tumbled. The University of Michigan’s Consumer Sentiment Survey showed that consumer pessimism deepened throughout the second quarter, largely due to inflation concerns. The June sentiment reading was 50, which is the lowest on record.
- The yield curve isn’t feeling it – yet. Many people anticipate a recession, but bond markets don’t seem to think so, at least not yet. One of the most credible recession-forecasting tools is the yield curve. When the yield curve inverts, meaning shorter-term Treasuries yield more than longer-term Treasuries, there is a significant probability that a recession is coming. More specifically, while we also consider the 2-year versus 10-year yield curve, comparing the three-month yield with the 10-year yield provides the most accurate results.
When a three-month Treasury bill yields more than a 10-year Treasury note (or Government of Canada bond here north of the border) a recession is likely in the following 6 to 18 months, according to a study from the Federal Reserve Bank of New York.
At the end of June, the three-month U.S. Treasury yielded 1.72 percent and 10-year Treasury yielded 2.98 percent. In other words, the yield curve was not inverted. This is comparable to the three-month Canadian Treasury bill rate, which ended June at 2.09 percent, versus the 10-year Government of Canada Bond, which finished the month yielding 3.23 percent.
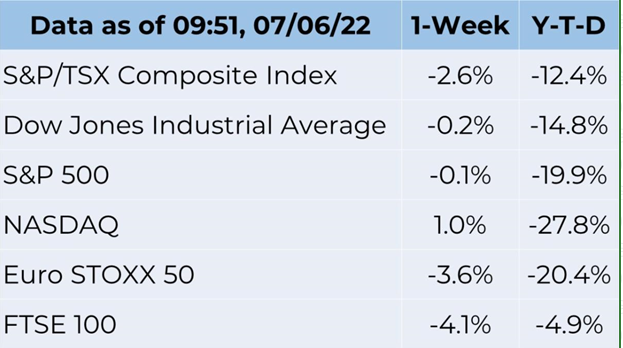
Last week, major North American indices finished the week lower. The yield on benchmark 10-year U.S. Treasuries and Government of Canada bonds also moved lower.
Markets are likely to remain volatile. If you have any questions or concerns about your investment portfolio or current market events, please don’t hesitate to give us a call.
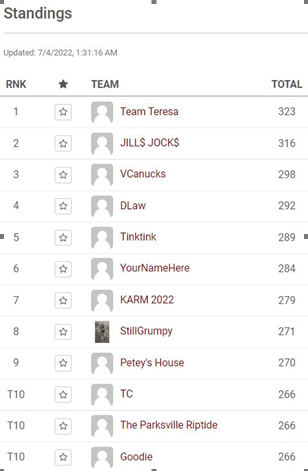
Congratulations to the winners of this year's hockey pool!
The top three have been contacted about their reward.
How long does it take you to decide what to watch?
We’ve all been there: scrolling through shows – more than 817,000 of them – trying to decide what to watch. Almost half (46 percent) of us find the experience overwhelming, according to Nielsen’s State of Play report. According to a survey conducted in the United Kingdom, the average household spends:
- 12 minutes each day bickering over what to watch,
- 16 minutes channel surfing, and
- 12 minutes trying to find specific shows.
Do the math and 40 minutes a day times 365 days a year is 14,600 minutes. There are 60 minutes in an hour and 24 hours in a day, so we spend about 10 days a year deciding what to watch.
That’s a drop in the bucket compared to the amount of time spent watching video content. The average American spends 4 hours and 49 minutes a day – or 68 days a year – watching video content on TV screens. About three hours are spent watching programming, and almost an hour-and-a-half is spent watching content on devices connected to TV screens.
So, what are we watching? According to Nielsen’s report, “Between January and September of last year, 98% of the most viewed broadcast programs were sports.”
Weekly Focus – Think About It
“History is not everything, but it is a starting point. History is a clock that people use to tell their political and cultural time of day. It is a compass they use to find themselves on the map of human geography. It tells them where they are but, more importantly, what they must be.”
—John Henrik Clarke, writer and historian
Recent Videos:


Eric Muir
B.Comm. (Hons.), CIM®, FCSI
Portfolio Manager
Tracey McDonald
FCSI, DMS, CIM®
Portfolio Manager
Derek Lacroix
BBA, CIM®, CFP®
Associate Financial Advisor
P.S. Please feel free to forward this commentary to family, friends, or colleagues. If you would like us to add them to the list, please reply to this email with their email address and we will ask for their permission to be added.